Adds 3D charts, GS1 barcodes and new electronic signature component.
Features
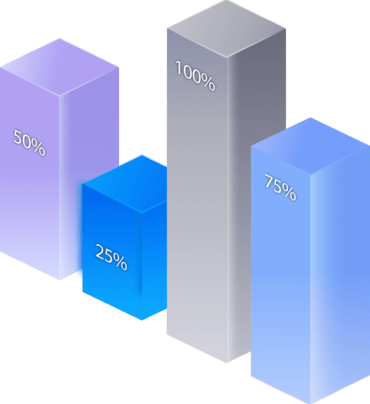
New 3D Charts
- You can now display 3D Clustered Column, 3D Stacked Column or 3D Full-stacked Column charts in reports and dashboards.
- You can change the geometry of the series to either Box, Pyramid or Partial Pyramid.
- When creating a standard 3D multi-series bar chart, you can specify the display mode to be either 'side by side' or 'behind'.
Optimizing JavaScript Components
- The support of various screen scales has been added to the following products: Reports.JS, Reports.PHP, Dashboards.JS and Dashboards.PHP.
- Now you don't need to include CSS files when using JS components in a project.
- All images used in JS products have been converted to 'WebP' format.
- Added a new method - 'setTheme(themeName)' to set the theme of the designer and viewer.
New GS1 Barcodes
- Added support for GS1 DataMatrix and GS1 QR Code barcodes.
MariaDB Data Source
- Added new adapter for getting data from MariaDB Servers.
- After creating a connection and running your query, you can create reports and dashboards based on the retrieved data.
Electronic Signatures
- Using this new component, you can sign reports graphically - enter, draw or insert an image of a handwritten signature.
- You can add text, for example, name, initials, company, job title, etc.
- You can sign a report in design mode or when viewing it.
PDF Digital Signature
- Using this new component, you can add digital signatures to reports (using Adobe PDF) after converting them to PDF.
- To display the Electronic Signature and Digital PDF Signature elements on the toolbox, you should flag them in toolbox settings.
New Authorization Options
- You can now log in to the Stimulsoft platform using web services such as GitHub and Facebook.
- Use the credentials from these services when logging into the report designer, company or personal account or Stimulsoft Cloud.
Formatting Dates in Text Elements
- Apply date formatting to Text elements in dashboards.
Title Alignment in Table Elements
- Horizontally align column title text in dashboard Table elements.
- Alignment is configured for each table column using the Horizontal Alignment property. It has the following values that correspond to the position of a title - left, right and center.
Time intervals in Dashboard Gauge Elements
- You can now use all types of gauges to visualize time intervals.
- Specify data columns and set the 'date' and 'time' parameters in the element editor.
- Time interval range can be specified automatically or manually.
- Elements can also display the target value as a date.
Interface Improvements
- Improvements to the appearance and usability of the report designer.
- New Microsoft Office 2022 design theme has been added for web components.